Optimizing the Metal pipeline to maintain 120 FPS in GPUI
February 7th, 2024
Zed feels smoother than ever with today's release of 0.121, thanks to a series of optimizations that began on the kitchen table of popular streamer Theo Browne. In an excellent video following our open source launch, Theo gave a bunch of great feedback, but what really stood out was his report of janky scrolling performance. That really surprised us, because that wasn't something we had experienced on our hardware.
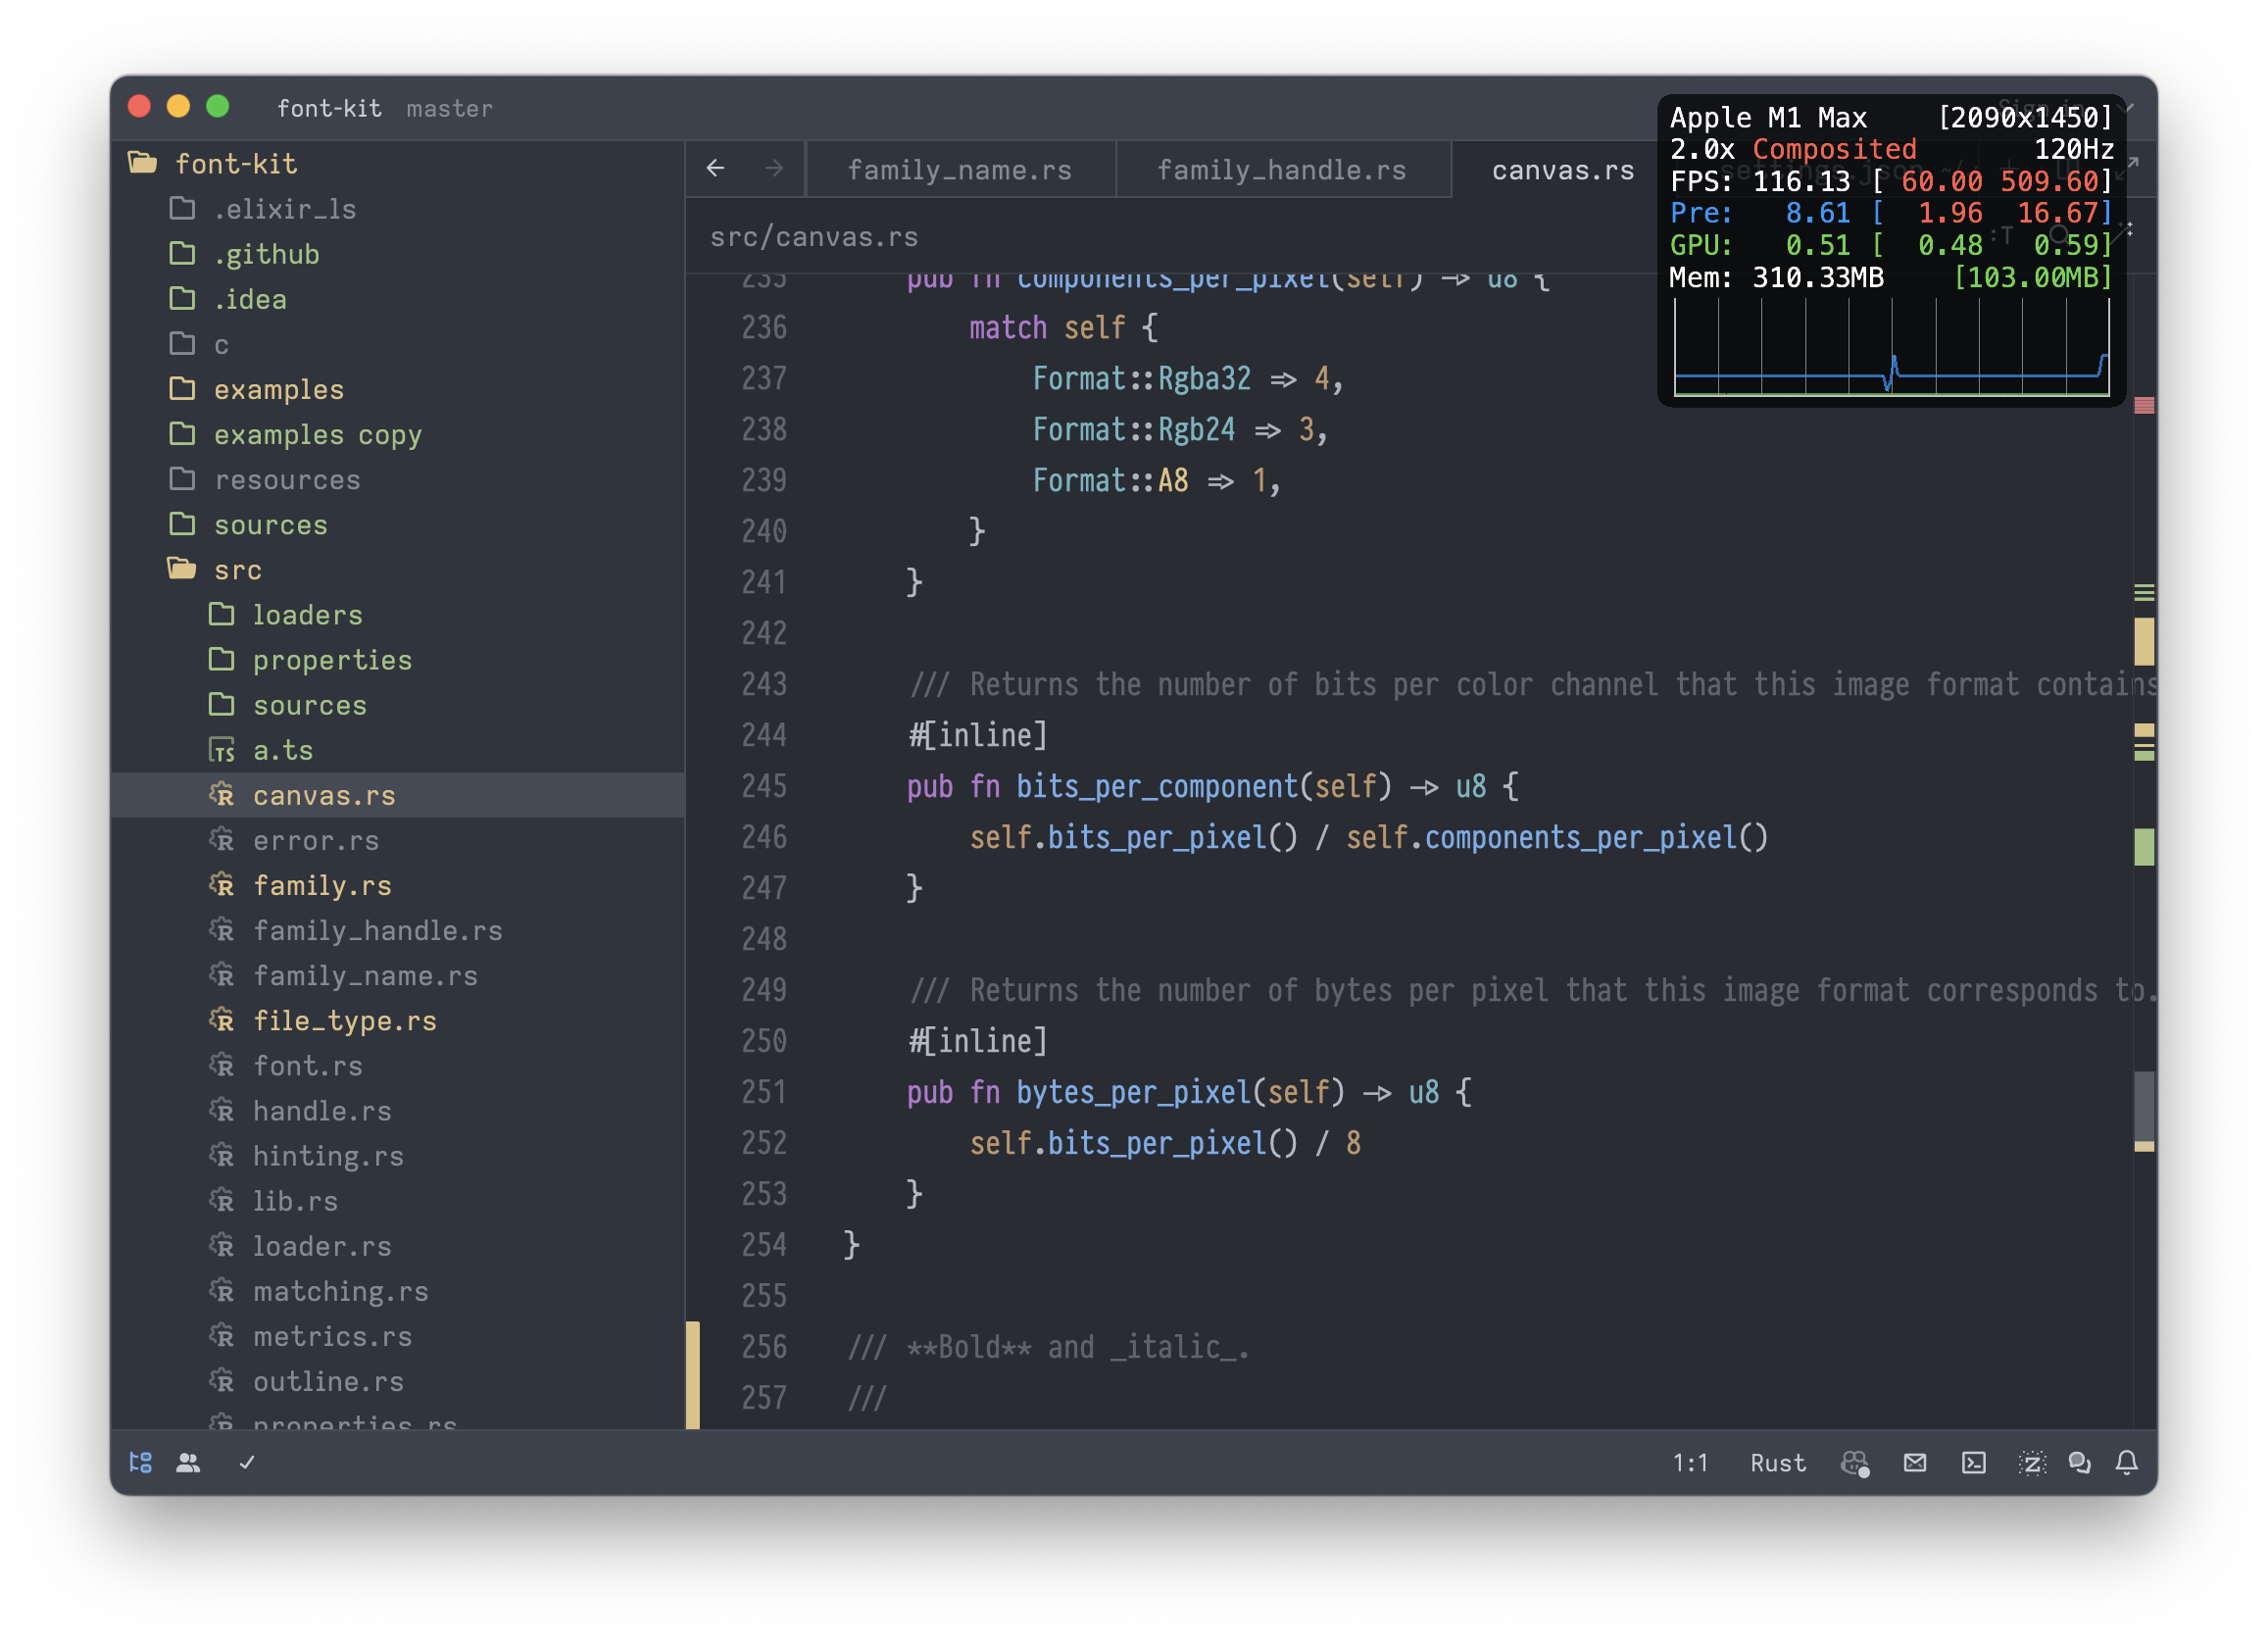
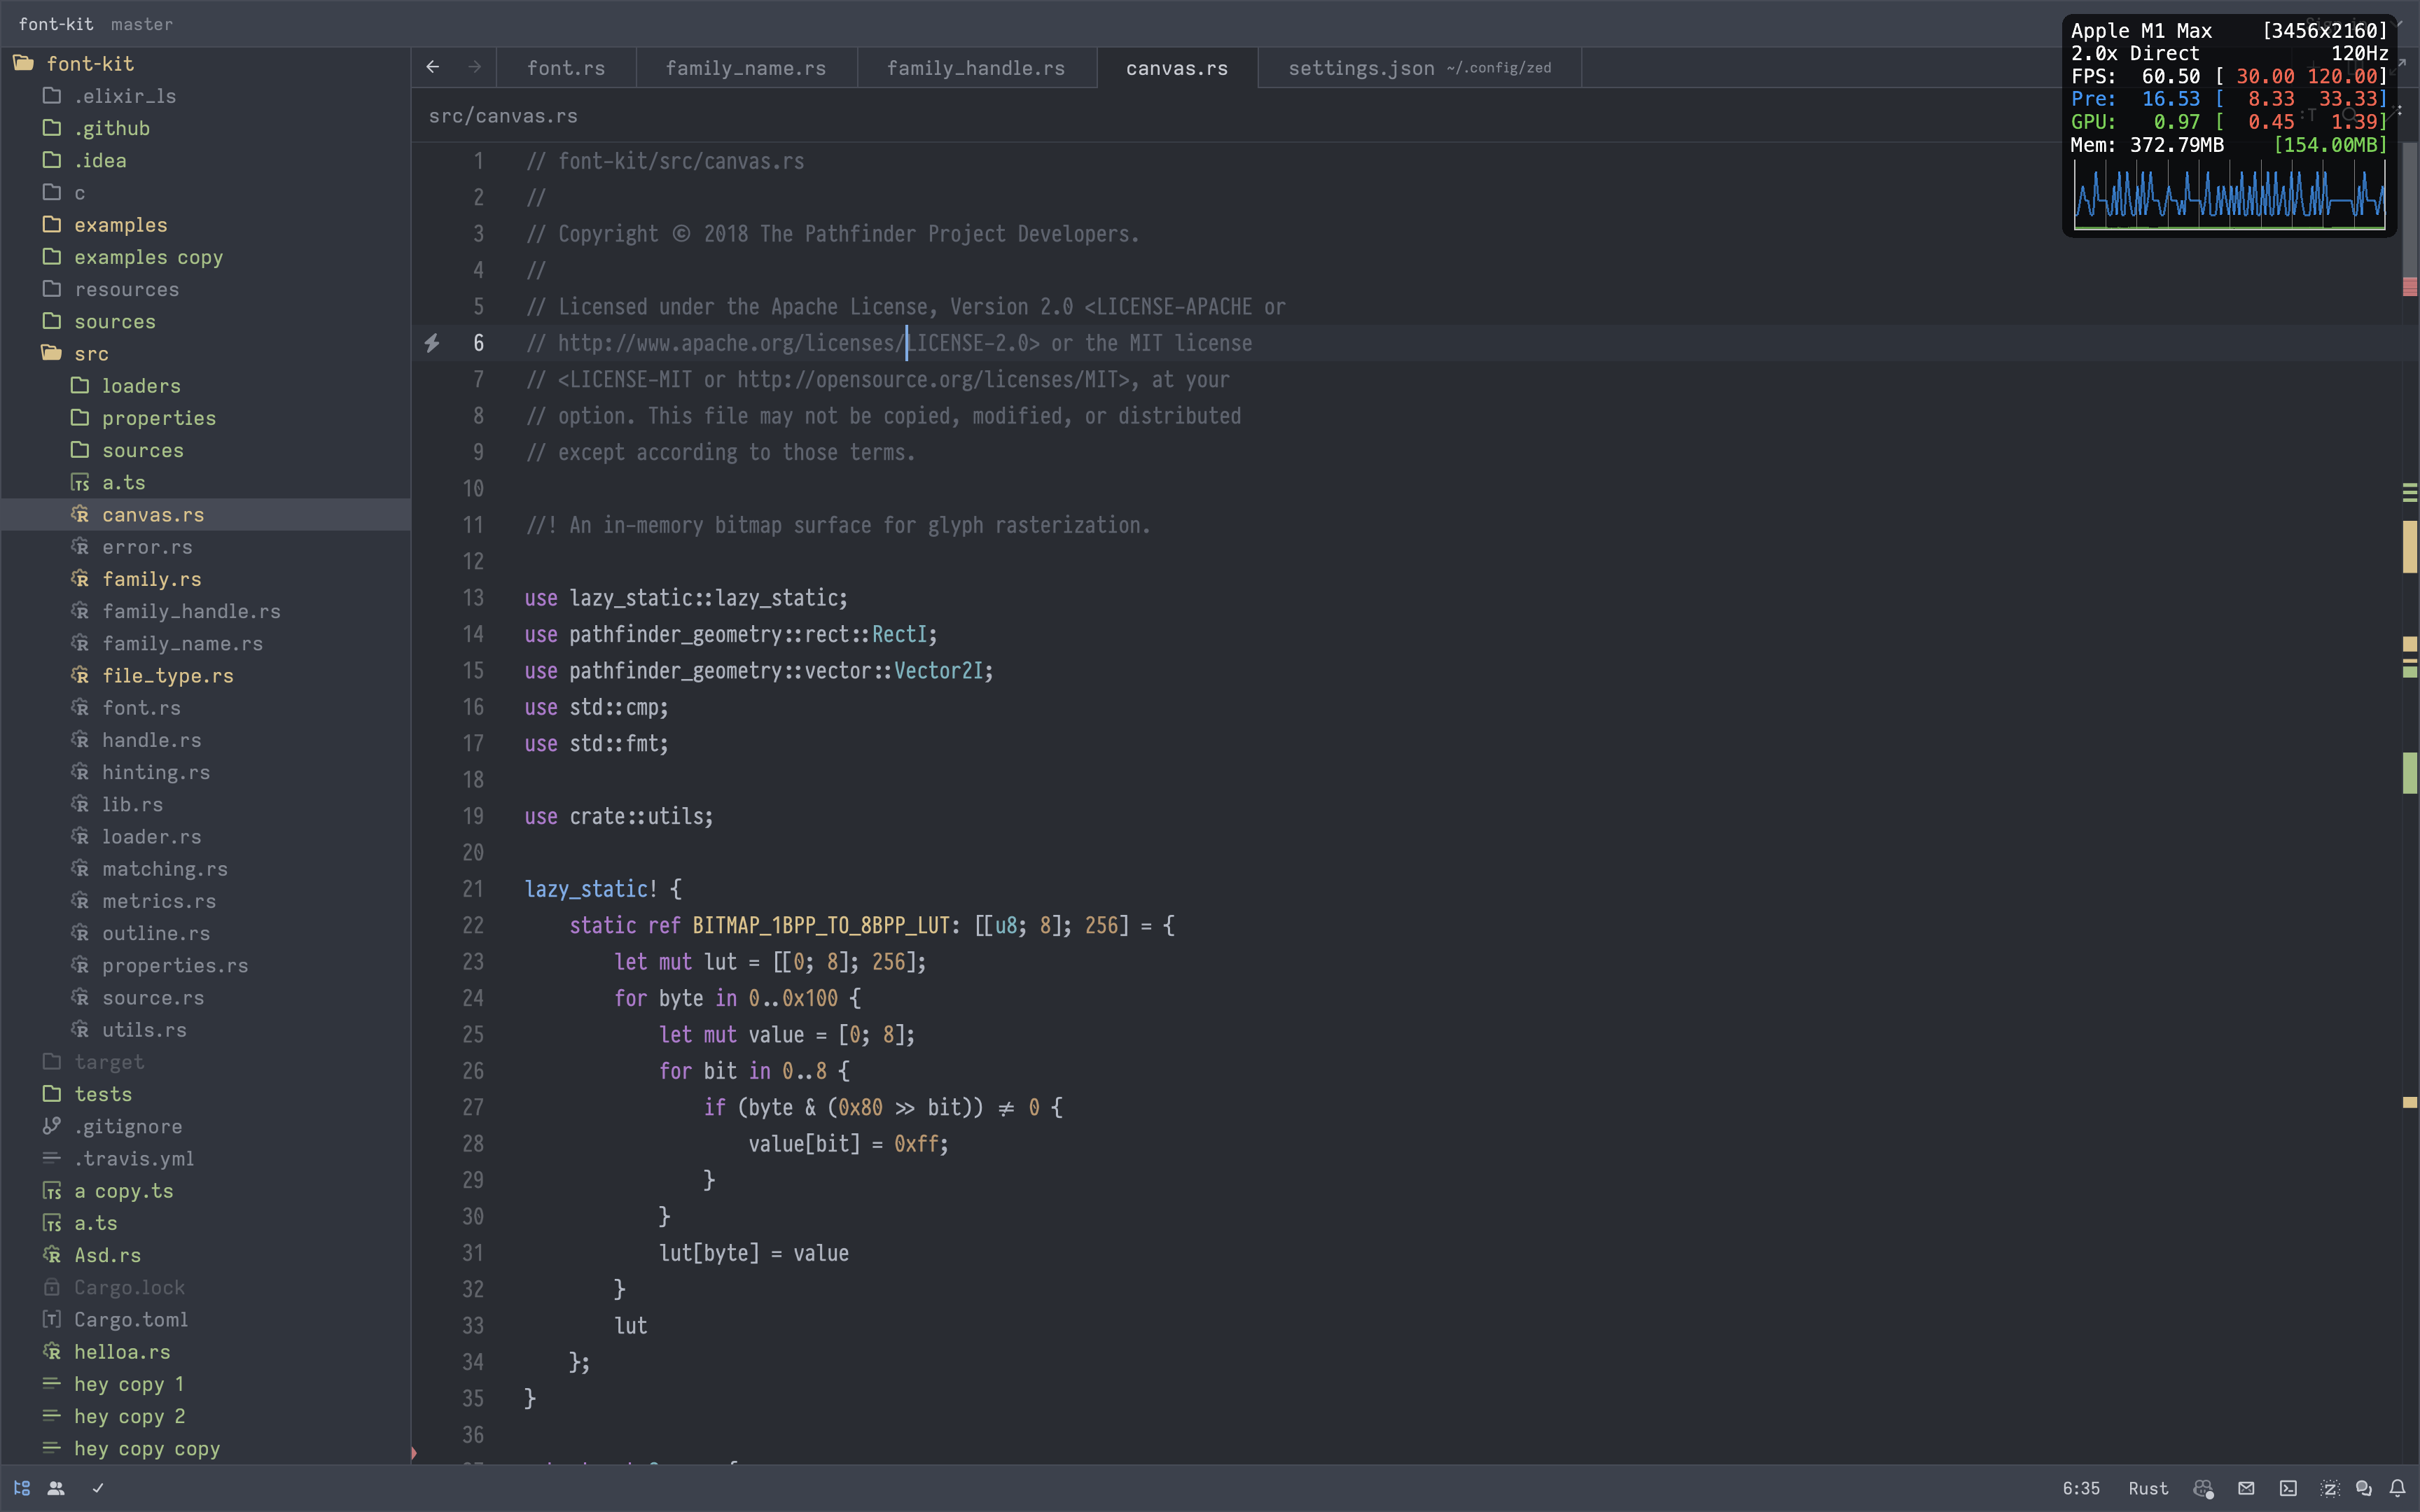
Zed's three founders happened to be in San Francisco, so we asked Theo if we could visit and observe Zed running on his machine. Sure enough, on Theo's M2 MacBook, we indeed observed Zed dropping frames that wasn't visible on our M1s, so we enabled the metal HUD on his copy of Zed to investigate.

What stood out immediately was that Zed was running in direct mode on his M2, whereas on our M1s it was running in composited mode. In composited mode, rather than writing directly to the display's primary frame buffer, applications write into intermediate surfaces that the Quartz compositor combines together into the final scene. We recently learned that to enable direct mode on M1s, you have to run the app full screen. We rarely enable that mode, but as soon as we did, we immediately reproduced Theo's issues. The compositor introduces latency, so you would think bypassing it would make Zed perform better, yet we observed the opposite.
We quickly began to suspect logic we added to GPUI's MetalRenderer to ensure AppKit's redraw of our window was properly synchronized with the contents of the window we draw via Metal. By default, presenting to a CAMetalLayer does not block drawing of the window by the OS, forcing the system to interpolate the windows contents from the previous frame by stretching them until the contents arrive on the next frame. This might be good enough for a video game, but it wasn't a good fit for a desktop app.
To avoid this, we enabled presentsWithTransaction on the CAMetalLayer that backs the root view of every GPUI window, which coordinates the presentation of the layer's contents with the current CoreAnimation transaction. We also blocked the main thread on the presentation of the new window contents by calling waitUntilCompleted on the command buffer. This ensured the main thread couldn't finish drawing the window until we finished presenting its contents.
Here's a few lines from the end of MetalRenderer::draw:
self.instance_buffer.did_modify_range(NSRange {
    location: 0,
    length: instance_offset as NSUInteger,
});
command_buffer.commit();
// Blocks the thread to avoid jitter.
// We can't finish drawing the window until its contents are completed.
command_buffer.wait_until_completed();
drawable.present();
The code above contains a bug. It works well enough in composited mode, where "completed" means that pixels were written into the intermediate buffer of the compositor. However, in direct mode, "completed" means pixels actually being written to the frame buffer of the graphics card, and we observed this call blocking significantly longer in that state.
The solution was to retain our synchronization, but relax it somewhat by calling wait_until_scheduled instead of wait_until_completed. This ensures the windows contents are scheduled to be delivered in sync with the window itself, while avoiding an unnecessarily long blocking period.
Antonio built a binary on Theo's dining room table and AirDropped it to him to confirm it solved janky scrolling. Problem solved.
Triple buffering
Well... not quite. In our haste to catch an Uber to make our flight to Boulder, we neglected to fully consider the implications of our change. Shortly after merging, Thorsten and Kirill started noticing corruption in our rasterized output.

One look at the screenshots gave us a pretty clear clue. By switching from wait_until_completed to wait_until_scheduled, we introduced a race condition. In some cases, as the GPU was reading memory from frame N, Zed was writing to that same memory to prepare to draw frame N + 1. To solve it, we replaced the single instance buffer that worked when rendering was fully synchronous with a pool of multiple instance buffers. We acquire an instance buffer from the pool at the start of the frame and release it asynchronously once the command buffer has completed:
// Acquire an instance buffer from the pool.
let mut instance_buffer = self.instance_buffer_pool.lock().pop().unwrap_or_else(|| {
    self.device.new_buffer(
        INSTANCE_BUFFER_SIZE as u64,
        MTLResourceOptions::StorageModeManaged,
    )
});

// Populate this buffer with primitives to draw in this frame
// ...

instance_buffer.did_modify_range(NSRange {
    location: 0,
    length: instance_offset as NSUInteger,
});

// Associate the command buffer with a "completed handler"
// which returns the instance buffer to the pool asynchronously
// once the frame is done rendering.
let instance_buffer_pool = self.instance_buffer_pool.clone();
let instance_buffer = Cell::new(Some(instance_buffer));
let block = ConcreteBlock::new(move |_| {
    if let Some(instance_buffer) = instance_buffer.take() {
        instance_buffer_pool.lock().push(instance_buffer);
    }
});
let block = block.copy();
command_buffer.add_completed_handler(&block);

command_buffer.commit();
command_buffer.wait_until_scheduled();
drawable.present();
After correcting for the oversight around instance buffers, we felt like we had a solid solution.
ProMotion and CADisplayLink
But then we noticed something. Scrolling was smooth, but cursor movement really wasn't. We both have our cursor repeat rate boosted to 10ms, and we'd notice intermittent dropped frames when moving in direct mode. We could see them with our eyes, even though we were consistently measuring frame times under 4ms. Why were we dropping frames?

Only after staring at a timeline in instruments did a question occur to us. What if we were rendering in under 4ms, but the frames weren't being actually being delivered at that frame rate. That's when we thought about ProMotion, a feature which modulates the displays refresh rate to save battery. Antonio disabled ProMotion on his laptop, and the hitches disappeared.
Our next question: How could we prevent the display from downclocking? We did some research, and learned more about the CADisplayLink API, which synchronizes with the display's refresh rate and invokes a callback each time the display presents a frame. Through experimentation, we discovered that if we consistently present a drawable on every frame, the display will continue to run at a constant refresh rate. As soon as we neglect to draw a frame, its refresh rate drops.
So we now render repeated frames for 1 second after the last input event to ensure max responsiveness. This allows the display to downclock after a period of inactivity to save power, but ensures it doesn't do so while we're interacting with Zed. Now, when you're actively editing, we ensure the display is ready to respond to your input with minimal latency.
In GPUI, we abstract over the CADisplayLink with the on_request_frame method on the PlatformWindow trait. Here's the full code responsible for maintaining the refresh rate for 1 second after input:
platform_window.on_request_frame(Box::new({
    let mut cx = cx.to_async();
    let dirty = dirty.clone();
    let last_input_timestamp = last_input_timestamp.clone();
    move || {
        if dirty.get() {
            measure("frame duration", || {
                handle
                    .update(&mut cx, |_, cx| {
                        cx.draw();
                        cx.present();
                    })
                    .log_err();
            })
        } else if last_input_timestamp.get().elapsed() < Duration::from_secs(1) {
            // Keep presenting the current scene for 1 extra second since the
            // last input to prevent the display from underclocking the refresh rate.
            handle.update(&mut cx, |_, cx| cx.present()).log_err();
        }
    }
}));
With a bit more refinement to pause the display link on inactive windows, we now have a much better performing solution. We also understand much more about graphics programming than we did last week.
Conclusion
Thanks again to Theo for taking the time to help us discover this hidden issue, and a big shoutout to the community for helping us test this out across a variety of displays. We now have a much better understanding of direct vs composited mode and the impact of ProMotion on responsiveness.
We ship to learn here at Zed, and clearly our learning process around these optimizations is evidence for that. Thanks to what we learned these past few days, v0.121.5 should feel like the smoothest Zed ever. If that's not the case, we hope you'll let us know. Thanks for reading!
Addendum: The Day After, Capped at 60 FPS, Frozen UI and Going Back to 120 FPS
Thorsten here. The day after we published this post, our smooth scrolling through Zed was brought to a record-scratching halt when users on Discord and in GitHub issues reported that their scrolling wasn't smooth at all. In fact, it was capped at 60 FPS, they said, and felt jittery. Wait, what? How could that be? Then, on top of that, Mikayla, Conrad, and more users reported that the UI in their build of Zed occasionally froze for a second. Okay, what's going on?
Antonio and I started our day yesterday determined to get to the bottom of this. We turned on our Metal HUDs and, sure enough, there it was: a solid, unwavering 60, staring at us — mocking us? It didn't make sense: why did we get 120 FPS on the day before, reliably, but not anymore?
One user "fixed" the issue by factory-resetting their MacBook. That's obviously not something we can recommend to users, but it was a clue: the problem isn't necessarily in our code, but macOS can get in a state in which it doesn't ask an application to render more than 60 FPS. Then I found out that if I turn off ProMotion for my MacBook's display and turn it back on again, macOS asks Zed for for more frames again — back to 120 FPS. "Have you tried turning ProMotion off and back on again?" — also not a solution.
Antonio then had the idea of replacing our use of CADisplayLink with CVDisplayLink: the Core Video equivalent of the API we've been using. So we did and we followed Apple's instructions and example code to a T: use CVDisplayLink to get callbacks synced with the display's refresh rate, then use dispatch_source_create to push frame requests to the main queue, start & stop the display link when the window changes.
But it didn't work: with CVDisplayLink we were no longer capped at 60 FPS, but we never reached a stable 120 FPS, scrolling still felt bad and according to the Metal HUD our frame times were oscillating between 8ms and 16ms.
What followed were hours and hours of trying different things (if you want to be technical: grasping at different straws): changing priorities of queues, keeping track of frame times ourselves and exiting-early if we're called too often, telling macOS that we always prefer 120 FPS thank you very much — none of it worked.
Until we then had "might as well try it, why not?" moment and changed the exact bit of code that's shown further up in this post: we changed the very parts of our MetalRenderer::draw method that are explained above.
We took the newly introduced call to .wait_until_scheduled, removed it, turning this code
command_buffer.commit();
command_buffer.wait_until_scheduled();
drawable.present();
into this:
command_buffer.present_drawable(drawable);
command_buffer.commit();
And disabling presentsWithTransaction again.
The reason behind this change was that with CVDisplayLink we seem to be getting a high number of frame callbacks from macOS, but our synchronization code seems to then make it go out of sync.
With this change we went back to drawing as much as possible, as soon as possible (but keeping our triple-buffering).
The result: smooth, smooth scrolling at a stable 120 FPS. On my machine and, crucially, on Antonio's too, which he never restarted or reset and on which he also never turned ProMotion off and on.
If the phrase "this made my day" hadn't existed yet, I'm sure we would've come up with it yesterday. That flat, blue line in the Metal HUD, right below the 120 FPS, after a whole day of wrestling with this — it made our day.
The only problem with that approach is that it doesn't always work: when starting the application or resizing windows, we do want presentsWithTransaction and wait_until_scheduled, otherwise you can see wobbliness. But Antonio very quickly built a solution to that too, while I had to run off for half an hour, and then, after we recorded another conversation with the Zed founders, the whole team was already using a build with the complete fix in it. Nobody could report any problems.
Shortly after that two releases went out: Zed 0.121.7 and Zed Preview 0.122.2 — both contain this and another fix and should give everybody incredibly smooth scrolling at 120 FPS.